Lesson
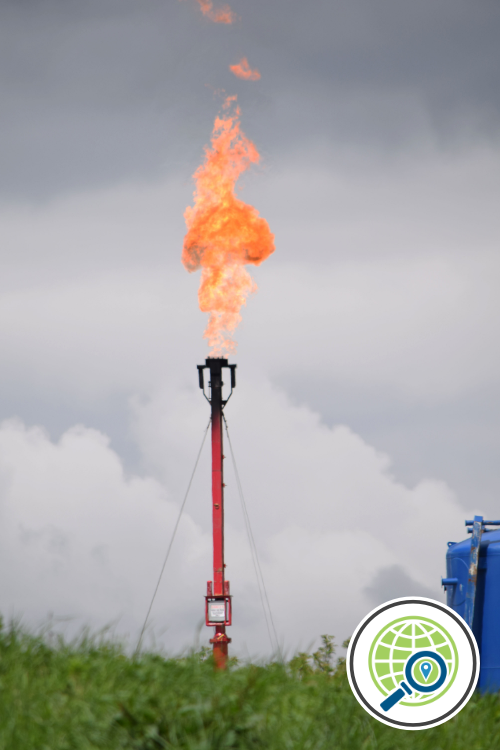
Photo Credit: Ted Auch, FracTracker Alliance, 2019. Aerial support provided by LightHawk.
Develop your geography skills by exploring an interactive map about plastics production and how it impacts communities.
Grades 7 and up
Time Needed 30 to 60 minutes
Standards
– Next Generation Science Standards MS-PS 1-3 Synthetic Materials,
– AP Environmental Science Unit 6.1 Renewable and Non-renewable Resources, Unit 6.5 Fossil Fuels
Subjects Synthetic Materials, Geography, Climate Change, Human Impact on the Environment, Environmental Justice
Materials Computer(s) for viewing map
Editable Handouts
– How and where are plastics produced? – Purpose and Context Google Doc
– How and where are plastics produced? – Student Worksheet Google Doc
– How and where are plastics produced? – Lesson Key Google Doc
Purpose and Context
Have you wondered: “Where do plastics come from?”
Plastics are commonplace in our lives, yet many people don’t know what natural resource we take from planet Earth to make them. Understanding how they are produced and the impacts that plastics production has on communities is important for addressing the urgent issue of plastic pollution in a way that is safe and healthy for the planet and its people.
Today, over 99% of plastics produced are made from fossil fuels! Two of the main building blocks for making plastics, ethane and propane, are derived from fossil fuels. [1]
Hydraulic fracturing (aka “fracking”) is a form of fossil fuel extraction and is a key part of the plastics production infrastructure in America and around the world. Fossil fuel companies use fracking to extract natural gas and oil that is found in shale rock formations underground. [2]
Watch this video to get a better understanding of how fracking works.
Once extracted by fracking, propane and ethane gasses go through a process known as “cracking”, using heat and pressure to change the gasses into propylene and ethylene, which are then made into two common types of plastics that we all use: polypropylene and polyethylene. [1]
The fossil fuel, petrochemical, and plastics industries have invested hundreds of billions of dollars into developing new fracking and plastics production infrastructure in the US. [3]
Fracking and the whole plastic production process negatively affects the health of people and the planet through air and water pollution, chemical exposure, and massive carbon emissions that contribute to climate change. [2,4]
Explore the following resources for information on the human health and environmental effects of fracking and the plastic production process
- Hurdle, J. (2022) As Evidence Mounts, New Concerns About Fracking and Health, Yale360.
- Center for International Environmental Law (CIEL) et al. (2019) Plastics & Health: The Hidden Costs of a Plastic Planet
Using maps to understand the plastic production process
FracTracker Alliance, a nonprofit based in the US, uses computer based mapping tools known as Geographic Information Systems (or GIS) to map, analyze, and communicate data on the oil, gas, and petrochemical buildout. GIS is all about presenting data spatially – in map form – which allows us to visualize and better understand the information.
In the following activity, use the map created by FracTracker Alliance to help visualize one possible pathway for a plastic soda bottle or snack pouch produced in America. Along the way, you’ll also learn how these processes can impact the surrounding communities.
Sources
[1] See Center for International Environmental Law. Fueling Plastics: Fossils, Plastics, & Petrochemical Feedstocks available at https://www.ciel.org/reports/fuelingplastics/ (last visited March 31, 2023).
[2] See Center for International Environmental Law (CIEL) et al., Plastics & Climate: The Hidden Costs of a Plastic Planet (2019), available at https://www.ciel.org/plasticandclimate/
[3] See The Guardian. $180bn investment in plastic factories feeds global packaging binge (2017) by Matthew Taylor available at https://www.theguardian.com/environment/2017/dec/26/180bn-investment-in-plastic-factories-feeds-global-packaging-binge (last visited March 31, 2023)
[4] See Center for International Environmental Law (CIEL) et al., Plastics & Health: The Hidden Costs of a Plastic Planet (2019), available at https://www.ciel.org/plasticandhealth/.
Instructions
Prepare
- Access the How and Where are Plastics Made? – Purpose and Context Google Doc and the How and Where are Plastics Made? – Student Worksheet Google Doc. These editable handouts can be printed or uploaded to your Learning Management System (LMS) for students to access and use online.
- Familiarize yourself with the GIS map below created by FracTracker Alliance and determine how you’ll facilitate the lesson. The map is best viewed and easiest to navigate on a large screen like a desktop, laptop, or tablet.
About the Map
This map illustrates the plastic production process – a long technical process involving massive infrastructure like factories, pipelines, fracking wells, and more. The map shows one possible pathway for the production of a plastic item like a plastic soda bottle or snack pouch produced in America. In reality, there are many other facilities across the US and around the world that are part of the plastic production process. This map shows just one of each facility involved in each stage of the process.
The map also highlights how these processes can impact the surrounding communities. This industry affects both communities and the environment through air and water pollution, and by contributing green house gases.
In Class
- Screen the Story of Plastic animated short (also at bottom of page) from 0:00 to 1:11 to introduce the issues connected with plastic production.
- Students explore the map, using the symbols in the legend to follow through the process of plastic production from hydraulic fracturing in West Pennsylvania, to manufacturing plastic packaging in Texas and Louisiana. Students should click on each symbol in the map to learn about that stage of the process. They can zoom in to see the area more closely, and explore the surrounding region. Remind students that this map shows just one example of each stage of the process. In reality this industry takes place throughout many regions of the US. But the Appalachia region and Gulf Coast region are heavily impacted.
- After exploring the map, have students complete the How and where are plastics produced? – Student Worksheet Google Doc to record their learning outcomes.
Extensions
- Screen the short documentary “Breathe this Air” (also at bottom of page) to learn more about the challenges that communities living near plastic production are facing, and the solutions they are advocating for. See journaling and discussion questions at the bottom of the page.
- Additional discussion ideas:
- How are the issues with plastics and climate change connected? What similarities do these problems share? Check out our follow-up lesson called “How is plastics production connected to climate change?“
- Human technologies usually have tradeoffs between benefits and negative consequences for ourselves and our home, planet Earth. See our lesson called “The Problem with Plastic – Think Pair Share.“
Lesson Walkthrough Video
Check out our Resource Spotlight video on Plastics, Fracking, and Climate Change where we interview Dr. Ted Auch of FracTracker Alliance, and walk through this lesson and the one that builds off of it: “How are plastic production and climate change connected?” The lesson walkthrough portion starts at 00:40:00 (see Chapters in Description).
Tips and Suggestions
- Click on each map icon to read more information in the pop-up box. Zoom out on the map so you can see the bigger picture. You will notice that fracking in Pennsylvania is connected all the way to plastics production in Texas!
- If there are terms in the map’s informational pop-up boxes that you don’t understand, take some time to look them up online.
Associated Standards
NGSS:
- MS-PS 1-3 Gather and make sense of info to describe that synthetic materials come from natural resources and impact society.
AP Environmental Science:
- 6.1 Renewable and Non-renewable Resources ENG-3.A.1 Nonrenewable energy sources are those that exist in a fixed amount and involve energy transformation that cannot be easily replaced.
- 6.5 Fossil Fuels ENG-3.F Describe the effects of fossil fuels on the environment. ENG-3.F.1 Hydrologic fracturing (fracking) can cause groundwater contamination and the release of volatile organic compounds.
![]()
This lesson was created in collaboration with FracTracker Alliance.
Educator Survey
Data is key. Help us understand how this free resource is being used.
Related Resources
Lesson: How is plastic production connected to climate change?
Analyze how plastics production contributes to greenhouse gas emissions using our interactive map.
Co-created with FracTracker Alliance
Grades 9 and up
60 to 90 minutes
Explore more
Breathe this Air: A #PlasticJustice Film
A short film about communities being impacting by plastic production.
The Story of Plastic (Animated Short)
A brief introduction to the issue of plastic pollution, produced by Story of Stuff.
Educator Workshop – Plastics, Fracking, and Climate Change with Guest Speaker Dr. Ted Auch, FracTracker Alliance
During this educator workshop we’ll help you get comfortable with two of our free lessons (grades 6 and up) that engage students in exploring the connections between plastic production and climate change. These lessons employ interactive digital maps produced by our partners at FracTracker Alliance. The lessons introduce students to GIS, an important analytical tool used in many disciplines especially environmental and social sciences. Guest speaker Ted Auch, Ph.D. of FracTracker Alliance explains the fracking industry’s connection to plastics, and talks about how their nonprofit brings together geography, data science, and policy to work towards environmental justice for communities across America and the globe who are impacted by fossil fuel extraction and plastic production buildout. For middle school, high school and college educators in Environmental Science, Social Science, APES, Geography, Political Science and related subjects.


