Lesson

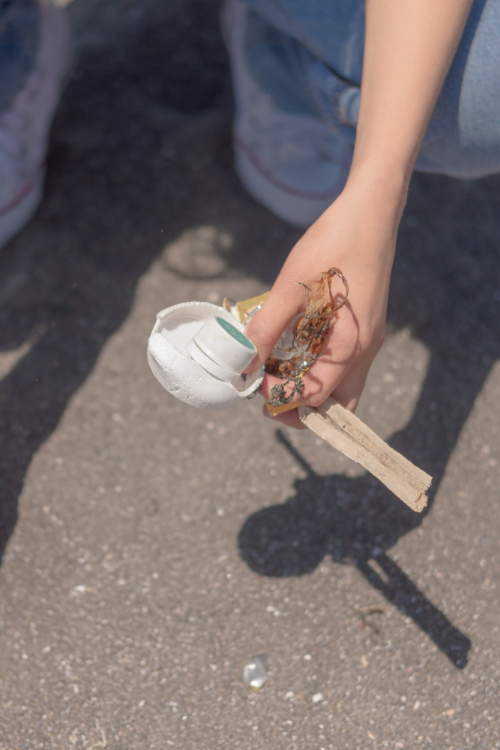
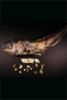
Photo Credit: Algalita.
Explore the phenomenon of biomagnification through simulations of the California marine food web. Construct an argument using evidence from a seafood investigation to show how changes in the ecosystem affect the marine fish populations.
Grades 7 and up
Time Needed 2-3 hours
Materials and Editable Handouts
- Biomagnification in the Food Web – Student Worksheet
- Biomagnification in the Food Web – Investigation Slides
- Biomagnification in the Food Web – Seafood Restaurant Cutouts
- 1 clamp lamp or flashlight with UV light bulb
- A highlighter
- Biomagnification in the Food Web – Biomagnification Simulation Data Table
- 4×6 in. envelopes or small paper cups (need enough for half the students in your class)
- Access to an outdoor or other empty space – preferably grassy or carpeted
- 1-2 cups of unsalted sunflower seeds (bird seed) or beans
- A poster or transportable white board
- Biomagnification in the Food Web – Organism Cards – print 1 set per group
- Biomagnification in the Food Web – Trophic Pyramid Outline – print 1 per group
- String or yarn – 1 yard per group
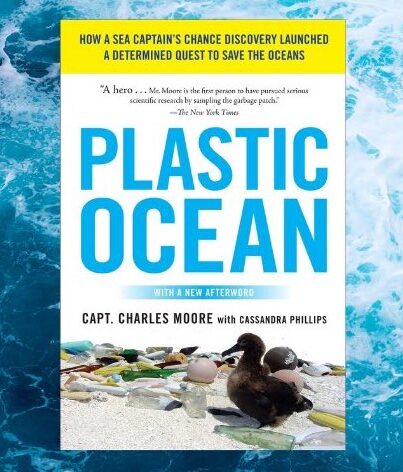
This lesson was co-created with middle school science educator Ashley Contreras, and high school educator Dori Hess. It is part of the NGSS MS-ESS 3-3 Human Impact – “Plastic Ocean” Standards Alignment Guide.
Purpose and Context
Plastic pollution is a contaminant that negatively impacts marine ecosystems. Plastic debris and litter can break down into microplastics that can easily enter the food web. Organisms, including zooplankton and small fish, may mistake plastic for food and directly consume plastic or may indirectly consume plastic through the consumption of their prey. Plastics can leach and absorb a class of chemicals known as persistent organic pollutants, or POPs. In a process called biomagnification, contaminants can accumulate and increase as they transfer from lower to higher trophic levels. By understanding this phenomenon, we can better understand how plastic pollution might be impacting human health.
Instructions
Engage: Seafood Restaurant
Set up: Make colored copies of the Biomagnification in the Food Web – Seafood Restaurant Cutouts. Add different amounts of highlighter to each type of seafood based on size. Tuna will have the most highlighter. Decrease the amount of highlighter used for each sample in the following order: mackerel, sardine, anchovy, and shrimp (shrimp will only have a few dots). Cut and laminate the seafood samples to create a class set. Organism cards for the food web may also be cut and laminated to create class sets.
Activity: Set up the classroom like a restaurant by having the restaurant slide from the Biomagnification in the Food Web – Investigation Slides displayed on the screen. *Note: Students may need to be reminded that they will be using their imagination for the class activity and that you will be leading them through a simulation of a similar scenario. Pass out the plates of fish (seafood cutouts) that are being served at the restaurant. There should be at least one of each type of organism on the plate for students to observe. Explain that the class is at a seafood restaurant and the chef has allowed us to check the seafood before it is prepared in the kitchen.
Ask the students the following questions:
- “How do you know the food at a restaurant is safe to eat”?
- “What steps do you take to make sure what you are eating is safe to eat”?
Instruct students to look at the samples of seafood and determine as a group if the seafood is safe enough to prepare based on their observations. After the students have discussed their answers, explain that you are going to do a simulation. *Note: This simulation is not an actual method of determining the safety of seafood but acts as a visualization for the students to make observations about potential concerns that exist in the marine food web.
Use a clamp lamp or any other lamp/flashlight with a UV light bulb that you can use to walk around the room to the different groups. Turn off the lights and walk around to each group and use the lamp to go over each seafood sample. (*Reminder, fish print outs require preparation to add highlighter so that the cutouts will glow under UV light. Test the light and cutout before the actual lesson). Have students make observations of what they see as the UV light passes over the seafood sample.
Ask students “what seafood sample had the most change under the UV light?” Have each group identify the seafood that had the most glow. Ask students “what does the ‘glow’ represent?”
After each group has made their observations, have students share their observations and answer Q1 and Q2 of the Biomagnification in the Food Web – Student Worksheet.
.
Explore: Types of Contamination in Marine Food Webs
Plastics and POPs:
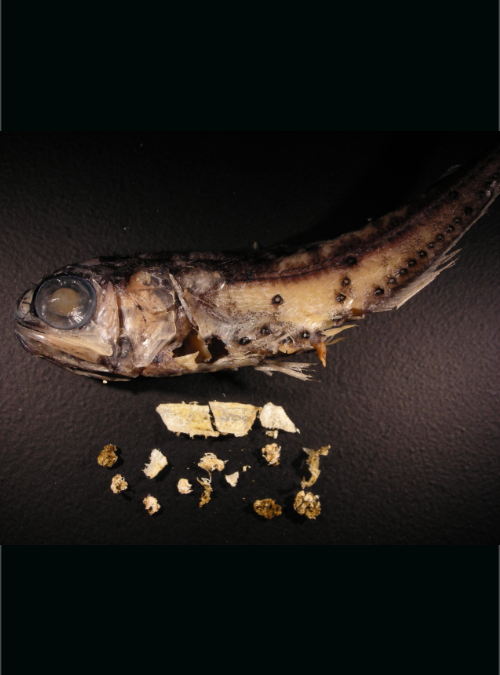
To learn more about the human-made contaminants affecting marine food webs, students will be prompted to look at a slide of a dissected fish that was collected from the same location the restaurant tuna was caught at. Students will analyze the photo and discuss as a group what material was found in the stomach of the fish. Students can share their answers with the class.
Have students discuss the following questions:
- “How did plastic get in the stomach of a small fish?”
- “How can plastic enter the food web?”
- “Why is plastic in the stomach of a fish a problem?”
- “What is plastic made of?”
Show students the slide of the different chemicals found in common plastics. Explain that plastic is made of different chemicals that may be toxic. Plastics can leach or absorb chemicals that may cause cancer or other health problems. These chemicals can be absorbed by living organisms when consumed.
Show students the slide of the North Pacific Gyre, one spot where plastic accumulates in the ocean, and discuss the various ways plastic enters the marine ecosystem. [See Sources and Sinks]
Algae Blooms and Biotoxins:
There are also naturally occurring toxins, called biotoxins, produced by certain algae. Under specific conditions, these algae rapidly reproduce, or bloom. The biotoxins can travel through the food web causing organisms who ingest large amounts to get sick. One type of biotoxin often impacting the California coast is Domoic Acid, a neurotoxin produced by a single-celled plant called Pseudo-nitzschia.
Explore: Biomagnification Food Web Simulation
Set up:
- Copy out the Biomagnification in the Food Web – Biomagnification Simulation Data Table onto a display board to bring out to the activity area.
- Establish a designated area that will be your “ocean”. Set up outside on a grassy area if possible. Use cones, chalk, or string to help make the boundary visible.
- Choose a small biodegradable item, like unsalted sunflower seeds or dry beans, to represent phytoplankton, the producers in the ocean food web. Randomly disperse several handfuls of “phytoplankton” throughout your “ocean” by scattering them on the ground.
- Explain to students that each plankton piece is contaminated. Choose one of the contaminants for the duration of the activity for clarity.
- Option 1. Human pollution contamination: microplastics. Each plankton (seed) is contaminated with 2 pieces of microplastic.
- Option 2. Natural Contamination: Domoic acid, a biological neurotoxin produced by certain algae. Each plankton (seed) is contaminated with 2 ppm of domoic acid.
- Assign each student to be an organism in the ocean food web.
- Half the students will represent shellfish. They are primary consumers. Give each “shellfish” a paper cup or small envelope and a spoon for collecting the plankton. Extension: Students create their own filter feeding mechanism and use it to pick up food. See Engineer a filter feeder.
- Half of the remaining students will represent crabs. They are secondary consumers.
- All but 1-3 of the remaining students will represent seals. They are tertiary consumers.
- The last 1-3 students will represent killer whales. They are quaternary consumers.
Activity:
- Trophic Level – Primary Consumers. Place each “shellfish” in a stationary spot in the “ocean”. Start a timer and give them 20 seconds to pick up plankton and place it in their envelope/cup, without moving their feet.
- Pause for Analysis. After the shellfish have completed their 20 seconds of feeding, instruct each student to add up the number of plankton they consumed (number of seeds) and their contamination concentration (number of seeds x2). Have each student announce their totals. Students who are watching record each shellfish’s totals on the data table.
- Trophic Level – Secondary Consumers. Send the “crabs” into the ocean and give them 30-45 seconds to crab walk (How to walk like a crab – see 00:17-00:24) and tag as many shellfish as they can (shellfish still can’t move from their spot). Once a shellfish is tagged, it must give their cup/envelop with seeds to the crab.
- Pause for analysis. Have the crabs add up the amount of shellfish that they have eaten and calculate their contamination level (# of seeds x2). Each student calls out their totals, and students who are watching record these values on the data table.
- Prepare for next round. Tell the shellfish to exit the ocean. Crabs will remain in the ocean. They should put all their seeds into one envelope/cup. Collect the extra empty envelopes/cups.
- Trophic Level – Tertiary Consumers. Send the seals into the ocean. Instruct them to tag as many crabs as possible by walking, giving them 30 seconds. The crabs can try to escape by crab walking! Once a crab is tagged, they will give their envelope/cup to the seal and leave the ocean.
- Pause for analysis: Have the seals add up the number of prey they consumed (number of envelopes/cups), and calculate their contamination level (# of seeds x2). Each student calls out their totals and students who are watching record the values on the data table.
- Prepare for next round. Tell the crabs to exit the ocean. Seals will remain in the ocean. Seals should put all their seeds into one envelope/cup. Collect the extra empty envelopes/cups.
- Trophic Level – Quaternary Consumers. Have the Killer Whales enter the ocean. Give them 20 seconds to tag as many seals as they can. Killer whales can run, but seals can only walk. When a seal is tagged, they give their envelope/cup to the killer whales.
- Pause for analysis. Have the killer whales add up their number of prey consumed, and their contamination level (# of seeds x2). Each student calls out their totals and students who are watching record the values on the data table.
- Return to a classroom setting for data analysis and discussion. Students work together complete the final column of the data table, calculating the average contamination level per organism in each trophic level. Have students complete the data table in their student worksheet. Students should visualize the data in a diagram or graph, for example comparing prey numbers, and contamination levels across trophic levels, completing questions 3-5 on their worksheet.
Explain: Making a Food Web Diagram and Explaining Biomagnification
Constructing a food web and trophic level pyramid. Food webs show how many organisms in a particular ecosystem are connected by predator-prey relationships. Trophic level pyramids show how energy, and also contaminants, move through an ecosystem from producers to the top consumers.
Set up: Print a set of Biomagnification in the Food Web – Organism Cards for each group of 4-6 students, and 1 Biomagnification in the Food Web – Trophic Pyramid Outline for each group.
Activity:
- First have groups construct a food web by connecting the organism cards with string or lines. You can use the Investigation slides to show an example of a marine food web. If students do not know what each organism eats, they can research each organism.
- Pair and share groups: Have each group compare their food web with another group, discussing differences.
- Then instruct groups to construct a trophic level pyramid, by placing the organism cards on the trophic pyramid outline and showing the direction of energy or contaminant flow.
- Pair and share groups: Have each group compare their pyramids with another group, discussing differences.
- As a class, discuss why the organisms in the highest trophic levels in both the restaurant simulation (tuna) and ocean food web simulation (killer whales), ended up with the highest contamination levels.
- As a class, work together to craft a definition of the phenomenon called biomagnification.
- Have students individually elaborate and reflect on the concept of biomagnification by answering questions 6-8 on their worksheet.
Extend: Options for continuing and applying learning
- Algae Blooms and Domoic Acid: Have students read Domoic Acid and discuss whether or not any of the crabs in the simulation were considered to be in “action level” and how this could be addressed.
- Plastic Pollution and Solutions: Direct students to independently, or collaboratively, design a solution for decreasing the amount of plastic that enters the marine food web. Students can make a diagram, describe a process or policy, or design a prototype. Have students present their solutions, critique each other’s solutions to improve and refine the ideas. Have students vote on the best design! This is a great opportunity to check out our Solution Set videos for inspiration. The first Solution Set video about Biomimicry – Better Design Inspired by Nature is a great fit for this extension activity.
- Have students practice reading scientific literature with this student reviewed research article on plastic ingestion by plankton.
Tips and Suggestions
This activity can be used in several different ways such as an engagement to introduce a phenomena, as a scientific investigation of human impact on marine ecosystems or as summative assignment after completing lessons on food webs and energy flow.
Change the species used in the activity to reflect species local to your nearby waterbody.
Resources- https://www.fisheries.noaa.gov/find-species
Associated Standards
Next Generation Science Standards
MS-LS 2-4. Construct an argument supported by empirical evidence that changes to physical or biological components of an ecosystem affect populations.
MS-ESS 3-3. Apply scientific principles to design a method for monitoring and minimizing a human impact on the environment.
Did you use this lesson?
Help us track our reach
Related Resources
Lesson: Sources and Sinks
How does plastic get into and impact ecosystems?
Grades 4 and up
30 to 60 minutes
Lesson: Plastics and our Health - Socratic Seminar
Investigate the consequences of plastics on the health of humans and other living organisms. Engage in a Socratic seminar exploring the ethical considerations of the harm to various species due to plastic production and use.
Co-created with educator Julie Keck-Centeno Ed.D.
Grades 9 and up
3-4 hours
Standards Alignment Guide: NGSS MS-ESS 3-3 Human Impact - "Plastic Ocean"
This guide will outline our suggestions for how to use a few of our resources to teach about the following Next Generation Science Standards (NGSS) Performance Expectation: MS-ESS 3-3 Apply scientific principles to design a method for monitoring and minimizing a human impact on the environment.
Grades 6 to 8
Variable Timing
Explore more
What are lanternfish?
Learn about a little known yet important fish species.
Learn more