Lesson

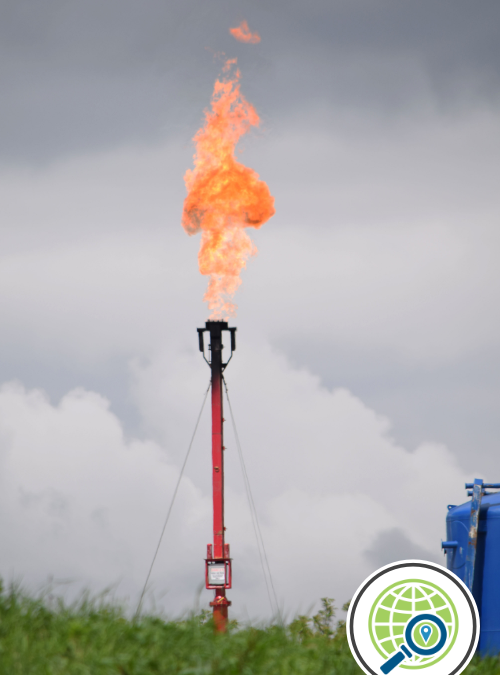
Photo Credit: Ted Auch, FracTracker Alliance, 2017.
Analyze how plastics production contributes to greenhouse gas emissions using FracTracker’s interactive map.
Grades 9 and up
Time Needed 60 minutes
Standards
– Next Generation Science Standards: MS-PS 1-3 Synthetic Materials, HS-ESS 3-1 Earth and Human Activity
– AP Environmental Science: Unit 6.1 Renewable and Non-renewable Resources, Unit 6.5 Fossil Fuels, Unit 9.4 Increases in Greenhouse Gases, Unit 9.5 Global Climate Change
Subjects Human Impact on the Environment, Climate Change, Environmental Justice, Synthetic Materials, Geography
Editable Handouts
– How is plastic production connected to climate change – Purpose and Context Google Doc
– How is plastic production connected to climate change – Student Worksheet Google Doc
– How is plastic production connected to climate change – Lesson Key Google Doc
Note This lesson builds off the lesson: How and where are plastics produced?
Purpose and Context
How is plastic production connected to climate change?
As the world moves to renewable energy and transportation, plastic production is the fossil fuel industry’s Plan B. The fossil fuel, plastic, and petrochemical industries have planned a massive infrastructure buildout (investing over $180 billion since 2010!) in the United States to increase the amount of plastic produced every year for the foreseeable future [1]. Fossil fuel extraction and the processes for producing plastic require a lot of energy and generate greenhouse gases. By 2050, the greenhouse gas emissions from producing (and incinerating) all this new plastic could reach over 56 gigatons, that’s 10-13% of the remaining carbon budget [2].
This industry buildout will lead to more plastic pollution, climate change impacts, and environmental injustices for many communities around the US. Consider the following example, a plastic production facility is located in the Gulf Coast flood zone. During a hurricane, exacerbated by climate change, a pipe is damaged and releases a toxic and flammable gas. Because of the flooding, the facilities’ workers have to evacuate the region and can’t go in to fix the pipe. The gas is released into the air and impacts the surrounding community. In this example, the frontline communities need to deal with compounding impacts caused by fossil fuel and petrochemical industries.
Instead of increasing plastic production, there needs to be investment in creating community-based zero waste systems where reusables and alternative materials replace fossil fuel-based plastics. As we transition away from plastics and fossil fuels, communities also need to make sure that workers are provided with lots of support for switching to new jobs. Imagine these workers becoming leaders for clean, renewable energy and reusable systems.
What is GIS?
Geographic Information System (GIS) tools like ArcGIS, are tools designed for digital mapping. They can be used to answer questions about how things are related geographically, and over time. In this lesson, we’ll be looking at where new facilities for production of oil and gas, plastic and other petrochemicals are being planned and built. These maps are incredible tools for identifying how the facilities may impact surrounding communities and how the facilities and communities may be impacted by climate change.
Sources
[1] See Taylor, M. (2017) $180bn investment in plastic factories feeds global packaging binge. The Guardian. available at https://www.theguardian.com/environment/2017/dec/26/180bn-investment-in-plastic-factories-feeds-global-packaging-binge last accessed on April 26, 2023.
[2] See Center for International Environmental Law (CIEL) et al., Plastics & Climate: The Hidden Costs of a Plastic Planet (2019), available at https://www.ciel.org/plasticandclimate/
Instructions
Prepare
- This lesson builds directly off the lesson How and Where are plastics made? The map in this lesson has a couple extra added layers of information that show recent and planned expansion of the fossil fuel industry.
- Review this StoryMap created by FracTracker Alliance, for yourself.
- Review, edit (if desired), and upload the How is plastic production connected to climate change – Student Worksheet Google Doc on your Learning Management System (LMS). Or, you can print copies.
- Determine whether you will explore the map together on your classroom screen or have students use their own devices.
In Class
- Students start by reading through the StoryMap created by FracTracker Alliance. As they scroll through each part of the story, students can explore the map and click on the icons and links to learn more. The full map is located at the bottom of the page.
- Students will use the information in the map to answer the questions on the student worksheet. The questions will require them to use certain tools in the map like the filter tool and the measure tool. (See tips below.)
- Following the group work, lead a class discussion about connections between plastic production and climate change.
Extensions
For NGSS ESS 3-1 (Construct an explanation based on evidence for how the availability of natural resources, occurrence of natural hazards, and changes in climate have influenced human activity.)
- Use the evidence in the map to write a short article that explains how the fossil fuel infrastructure spanning the US, flooding, and climate change have influenced fenceline communities in the Gulf Coast and Appalachian regions.
For Geography and GIS
- What do the size of the circles/bubbles represent in the map?
- What do the colors of the circles/bubbles represent in the map?
- How does the map utilize color, size, and shape of icons to illustrate complex information at a glance?

Lesson Walkthrough Video
Check out our Resource Spotlight video on Plastics, Fracking, and Climate Change where we interview Dr. Ted Auch of FracTracker Alliance, and walk through this lesson and the one that it builds off of: “How and where plastics produced?” The lesson walkthrough portion starts at 00:40:00 (see Chapters in Description).
Tips and Suggestions
- Look for this icon
 to use the Measure Tool, and this icon
  to use the Filter Tool. They should be in the bottom left corner of the map.
 - If possible, view the StoryMap on a desktop or other large screen device. It will be much easier to explore the map and to use the measure and filter tools.
Associated Standards
NGSS:
- MS-PS 1-3 Gather and make sense of info to describe that synthetic materials come from natural resources and impact society.
- HS-ESS 3-1 Construct an explanation based on evidence for how the availability of natural resources, occurrence of natural hazards, and changes in climate have influenced human activity.
AP Environmental Science:
- 6.1 Renewable and Non-renewable Resources ENG-3.A.1 Nonrenewable energy sources are those that exist in a fixed amount and involve energy transformation that cannot be easily replaced.
- 6.5 Fossil Fuels ENG-3.F Describe the effects of fossil fuels on the environment. ENG-3.F.1 Hydrologic fracturing (fracking) can cause groundwater contamination and the release of volatile organic compounds.
- 9.4 Increases in Greenhouse Gases
- 9.5 Global Climate Change
![]()
This lesson was created in collaboration with FracTracker Alliance.
Educator Survey
Data is key. Help us understand how this free resource is being used.
Related Resources
Lesson: How and where are plastics made?
Find out how plastics are produced in the US and find out how it impacts communities using geography tools like our GIS interactive map.
Co-created with FracTracker Alliance
Grades 7 and up
30 to 60 minutes
Lesson: Synthetic or Natural?
Contemplate the difference between synthetic and natural materials that make up common items in the classroom.
Grades 5 and up
30 to 60 minutes
Explore more
Breathe this Air: A #Plastic Justice Film
A short film about communities impacted by plastic production.
The Story of Plastic (Animated Short)
A brief introduction to the issue of plastic pollution, produced by Story of Stuff.
Educator Workshop – Plastics, Fracking, and Climate Change with Guest Speaker Dr. Ted Auch, FracTracker Alliance
During this educator workshop we’ll help you get comfortable with two of our free lessons (grades 6 and up) that engage students in exploring the connections between plastic production and climate change. These lessons employ interactive digital maps produced by our partners at FracTracker Alliance. The lessons introduce students to GIS, an important analytical tool used in many disciplines especially environmental and social sciences. Guest speaker Ted Auch, Ph.D. of FracTracker Alliance explains the fracking industry’s connection to plastics, and talks about how their nonprofit brings together geography, data science, and policy to work towards environmental justice for communities across America and the globe who are impacted by fossil fuel extraction and plastic production buildout. For middle school, high school and college educators in Environmental Science, Social Science, APES, Geography, Political Science and related subjects.